
DBS Announced their full year results early this week.
I thought I want to take some time to look through some of the financials over time in greater detail.
There should not be too much analysis but more of me talking through the numbers.
Dividend Payout Ratio
More and more investors are enamored with DBS as a stock to provide income for their retirement.
The chart below shows about 19 years of DBS’s dividend payout ratio:

Dividend payout is how much out of their net income do they pay as dividend.
If you see this change over time, I think it is safe to assume that how much management choose to payout is not going to stay consistent. Dividend payouts have been good for the past 5 years, but it is also good to recognize that the dividend payout also rose over the 5 years.
Income you receive is very much what you were expecting and how does the reality look like. If you expect your income to be of a certain sort, and it isn’t like that, then you would be rudely shock.
I got curious how come there is a period where the payout ratio was low for a period from 2010 to 2016. I was trying to see if I could get some answer here.
Return on Equity
Banks are usually value by how much you are paying for book value. What a bank earn traditionally is how you optimize between your deposits and loans and that forms a large part of your balance sheet. If you are able to lend out more, and at a higher rate then what you pay for deposits then you can make more. But if you don’t have enough deposits, then its also a problem.
And so the return on equity, when view over the long run, tells you for $1 of equity how well a bank earns. It may also help you see if some banks are better than the rest.
The ROE for the 3 local banks UOB, OCBC and DBS to 2024, is shown below:

DBS ROE is seriously high recently but we can see in 2006, OCBC also achieved that kind of ROE. But for a large part, their ROE is pretty much close to the other 2 banks. In fact, UOB and OCBC ROE also improved since 2021.
It feels like they are influenced by the same environment and not too different.
Is the Improvement Due to DBS’s Focus on Wealth Management?
I don’t know but I don’t think so.
The table below shows the break down in their revenue contribution:

The largest for a bank usually is from their lending business, but I think more and more, people seem to think that the net fee and commission income is becoming more significant.
Perhaps in 2026 it is but generally we see that the net fee and commission income is pretty proportionate to the overall revenue over time. Even if we say the margins for an AUM business is better, this should improve the ROE years ago above the normal 10-14% band long time ago.
I broken out the Net fee and commission income below:

DBS don’t derive a large revenue from Investment Banking and in the past, this was also made up of their brokerage business.

Wealth management is starting to be significant the last 2 years saw 45% and 29% growth, but in 2010 to 2013, DBS also saw significant wealth management growth, but their ROE hovers around 11% with no significant improvement.
I kind of don’t think this is what caused the big jump in ROE.
DBS Loan and Deposit Growth
I indexed the loan growth for the 3 banks to show how $1 will grow over the past 18 years:

This should show you if DBS grew its loans (and likely its deposits) at a higher clip than the others.
Turns out not really.
And in recent years, this hasn’t been the fast growth phase. That was more in 2008 to 2014.
That seems to coincide with the property boom haha.
Here is DBS loan and deposit growth:

Can kind of see that the loan and deposit will form the lower bound of the last 18 years.
Net Interest Margins
Perhaps the biggest link to ROE is the net interest margins.

This is the average margin that they loan out versus they paid for deposit.
In the recent high interest rate environment, the banks were able to still lend out but not paid so high for the deposits. So their NIM or net interest margin is pretty high.
Would that head down with potential recession or would we go back to a lower interest rate regime? I don’t know but I think this is an overhang.
NIM and ROE is not the most important thing, with lower interest, by right more people are interested in borrowing and the loan growth should be better (if recession is not too bad).
Cost Control
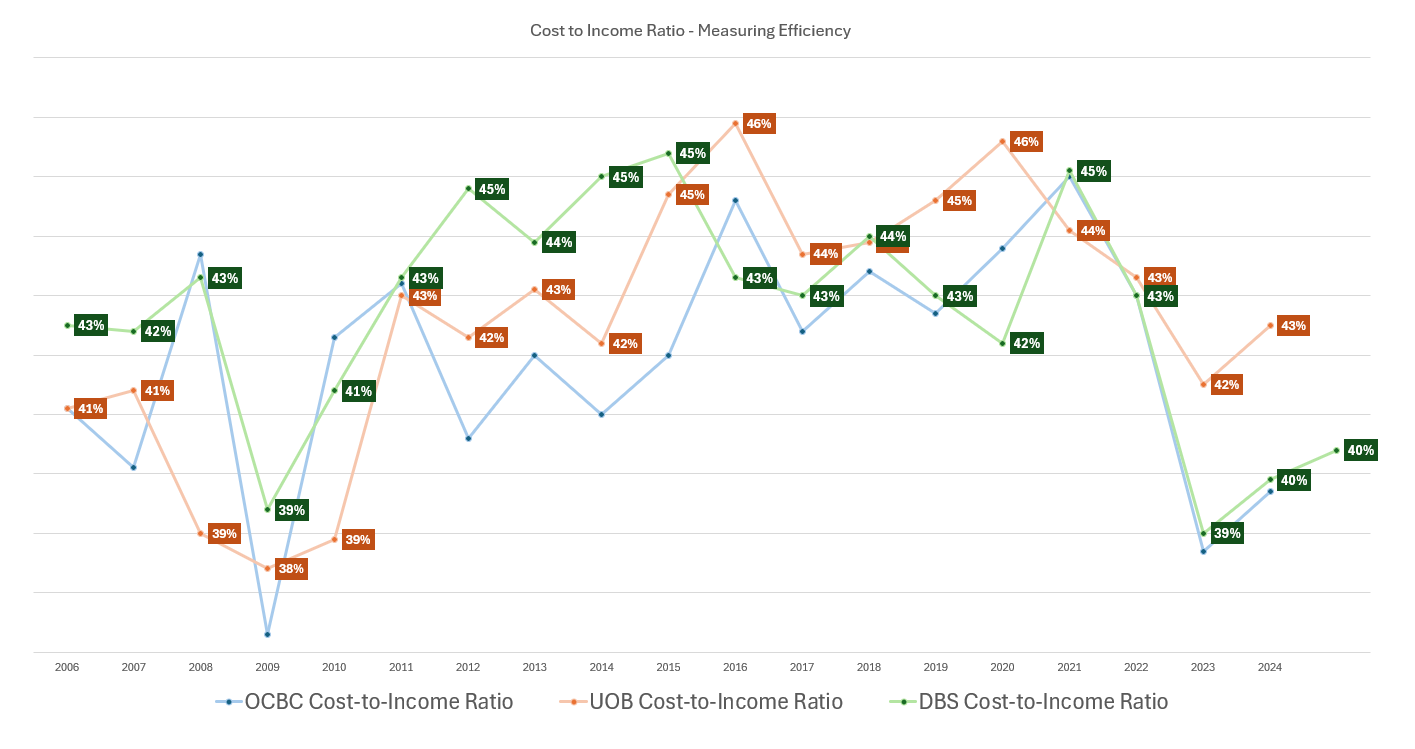
The cost to income ratio for the 3 banks shows how much is their non-loan business cost is relative to the income they earn.
By right, financial institutions should be able to achieving some economies of scope and as they consume more banks through acquisitions, they should be able to reduce their costs relative to income.
I plot the cost-to-income below:

You can see how much better DBS and OCBC can do in this regard relative to UOB.
But it has to be say 45% cost-to-income is very good already consider First Citizens Bancshares in the US has this between 55-60%.
Epilogue
After looking at the data, I kind of think that the better ROE from DBS is not due to one factor.
- Better cost control (lower cost-to-income)
- Higher margins (higher NIM relative to history)
- Perhaps some part really due to growth in card and wealth management business.
That is likely it.
I think after this the residual question is if interest rate environment is lower would the loan grow again with property price controls.
If you like this stuff and wanna tap into my money brain, do join my Telegram channel.
I share what I come across in:
- individual stock investing
- wealth-building strategies
- portfolio management
- personal finance, financial independence.
I would also share some of the thoughts of wealth advisory, financial planning and the industry that I don’t wanna put out on the blog.
Would probably share some life planning case studies based on the things I hear or came across as well.
Kyith is the Owner and Sole Writer behind Investment Moats. Readers tune in to Investment Moats to learn and build stronger, firmer wealth foundations, how to have a Passive investment strategy, know more about investing in REITs and the nuts and bolts of Active Investing.
Readers also follow Kyith to learn how to plan well for Financial Security and Financial Independence.
Kyith worked as an IT operations engineer from 2004 to 2019. Currently, he works as a Senior Solutions Specialist in Fee-only Wealth Advisory Firm Providend. All opinions on Investment Moats are his own and does not represent the views of Providend.
You can view Kyith’s current portfolio here, which uses his Free Google Stock Portfolio Tracker.
His investment broker of choice is Interactive Brokers, which allows him to invest in securities from different exchanges all over the world, at very low commission rates, without custodian fees, near spot currency rates.
You can read more about Kyith here.